Address
38 Eastwood Drive, Suite 401
South Burlington, VT 05403
Work Hours
Monday to Friday | 8AM—5:30PM EST
Address
38 Eastwood Drive, Suite 401
South Burlington, VT 05403
Work Hours
Monday to Friday | 8AM—5:30PM EST
In 2018, Out of Home advertising (OOH) was the sole traditional media that reported growth, estimating $33.5 billion in revenue. Not only did OOH advertising spend increase 4.5% in 2018 compared to the previous year, but it’s also seen 35 consecutive years of growth.
And studies predict OOH spend will hit $33 billion by 2021. Even digitally based companies such as Apple, Facebook, Netflix, and Spotify are utilizing OOH in their marketing mix. In this article, we explore what makes this seemingly simple form of marketing so formidable.
While many businesses are putting all their faith – and advertising money – into online marketing, the truth is that click-through rates have dropped to just .05%. The over saturation of online ads has led to “banner blindness,” and many people find them annoying and intrusive. This is especially true for younger generations.
Studies show 56% of Generation Z-ers don’t click on website ads, but 84% do pay attention to OOH ads. The simple fact is that consumers do not view OOH ads as invasive as online ads.
Someone passing by the same outdoor ad several times a day will not likely experience the same feelings of frustration as someone who sees the same online ad several time a day. Ergo, people are more receptive to OOH advertising’s message.
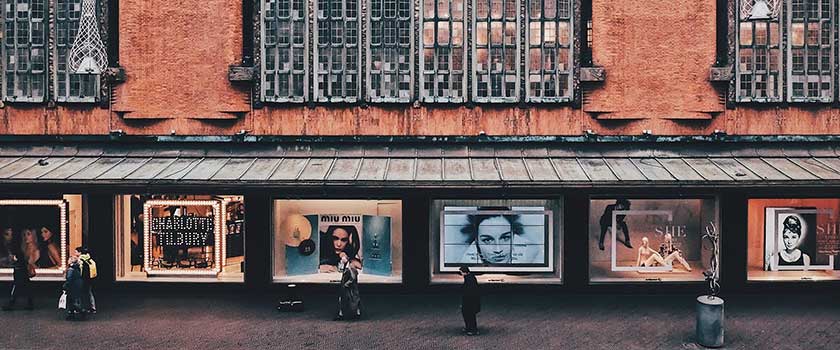
83% of marketers say advertising based on location produces high response rates and customer engagement. OOH advertising takes great advantage of this, as businesses have so many placement options. In addition to large billboards on the sides of roads or buildings, OOH is investing in experiential marketing: marketing that brings the ads closer to the consumer.
These ads are smaller in size. But when placed at eye-level locations, such as kiosks, subway platforms, and vehicles, consumers are more likely to notice them. And unlike larger billboards that can usually be only in one place, smaller OOH ads can appear in various places and continuously influence people throughout their day. Also, many ads use digital technology for a fun and interactive experience, which can lead to more interest and more sales.
With the average US citizen spending 70% of their time outside the home, it just makes sense for businesses to recognize the need for Out of Home advertising. And businesses can gather consumer data through tools from 800response. For instance, call tracking numbers to gain accurate insights into how to use OOH advertising most effectively. The numbers don’t lie: Out of Home advertising continues to be a force to reckon with – yesterday, today, and tomorrow.